Baltimore City’s up a significant amount, hitting its high for the year, while Ocean City’s still down off of the June peak.
Links on the side have been updated.

Baltimore City’s up a significant amount, hitting its high for the year, while Ocean City’s still down off of the June peak.
Links on the side have been updated.
The Baltimore Crime Blog reported that “a Department of Justice survey of multiple studies has concluded that license plate readers have no appreciable impact on crime rates.”
A check of The Office of Justice Programs’ CrimeSolutions.gov showed a rating for “License Plate Recognition Technology” of “No Effects – More than one study.” According to the site, this rating is used where “Programs or practices have strong evidence indicating that they had no effects or had harmful effects.”
In a middle-school book-report fed to policy makers for consumption, the people at CrimeSolutions.gov regurgitated various facts mentioned in the 2 studies they relied on to make that sweeping conclusion, but didn’t actually conduct any analysis to see if what they were reading actually stood for the propositions they were citing. (Ok, there were some big words in there… it was more like a poorly executed high-school book report)
The review relied entirely on 2 studies, both of which confirmed that LPRs are effective in identifying stolen vehicles and stolen registration plates, with collateral benefits related to identification of wanted persons and persons on various watch-lists (gang, terrorist, sex-offender).
Neither study demonstrated an impact on the crime RATE, but given the limited scope of the studies and the inherently mobile nature of auto-theft, this shouldn’t have been an expected outcome.
Continue reading
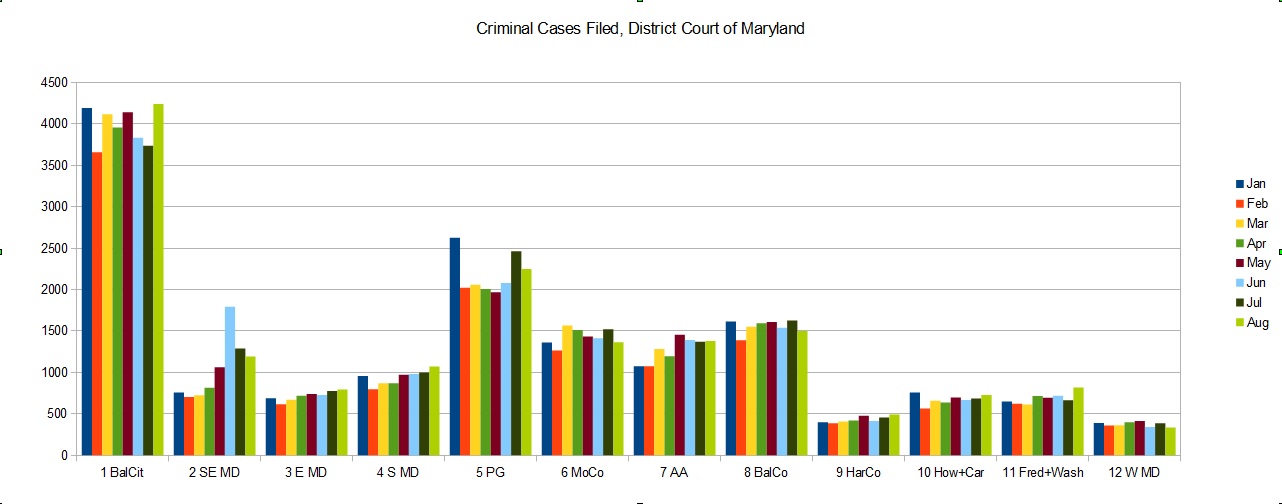
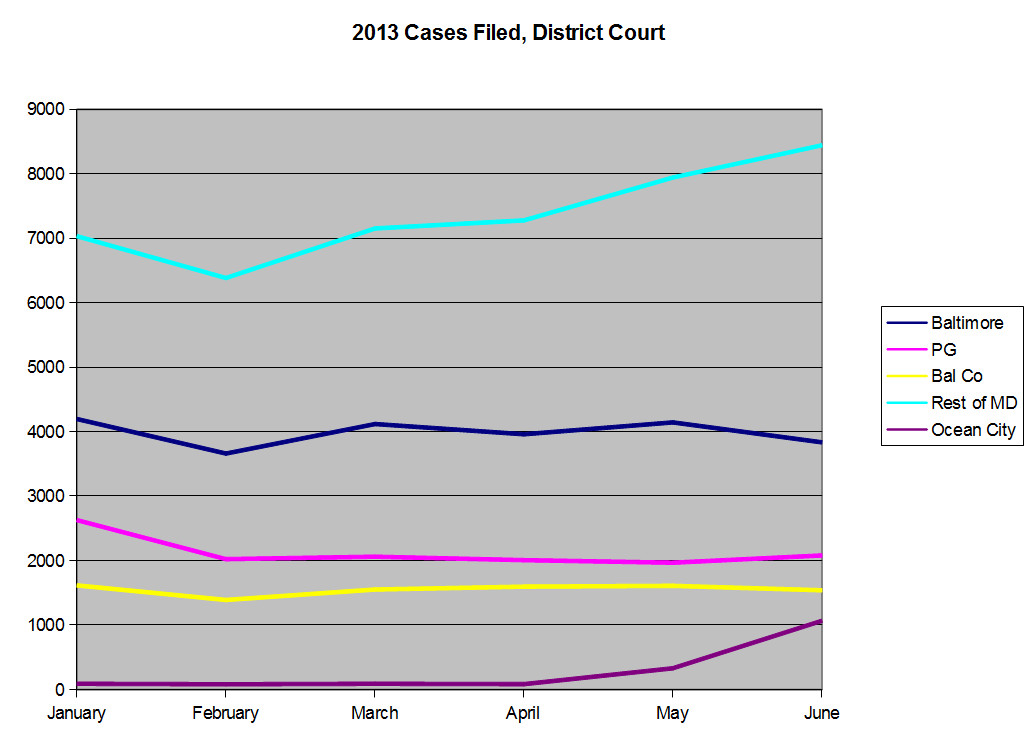
Happy days are here again! The spreadsheet links to the right have been updated with Jan-July 2013 data from all 12 District Court of Maryland districts. I’ll update prior years when I have time, but here’s a look at how the year’s progressing for the districts:
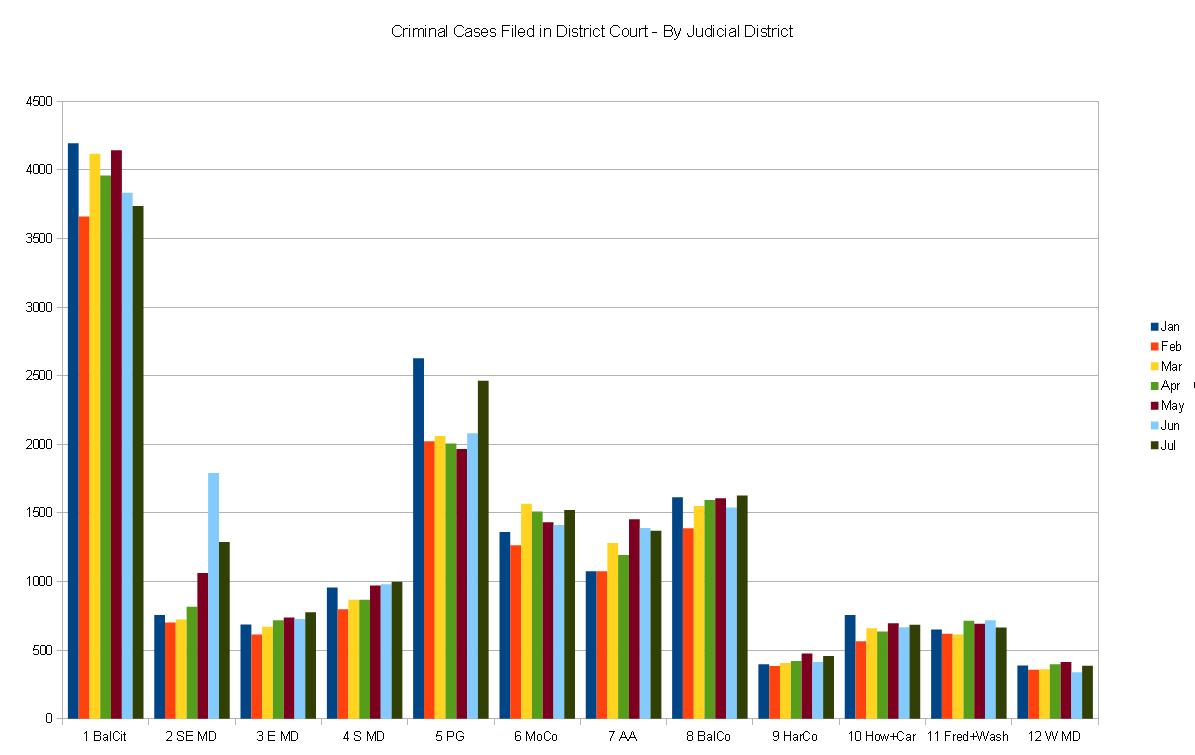
What’s interesting is the lack of similarity between high-crime areas (spikes for Baltimore City aren’t necessarily reflected in PG/BalCo/etc)
While the number of criminal cases filed in Ocean City jumped from 330 in May to 1066 in June, July cooled off to 580 cases filed(nearly a 50% drop).
Why was this? Was it the temperature? The average high for Ocean City was 60.6 in April, 68.6 in May (up 8), 78.6 in June (up 10), and 84.1 in July (up 5.5) representing an increase of 13.2% April-May, 14.6% May-June, and 7% June-July. There doesn’t seem to be a direct correlation between either average high temperature or change in average high-temperature, though the fact that the change in increase dropped from June-July may have some relationship to the decline in criminal cases filed.
Did precipitation temper an otherwise greater criminal showing? Precipitation in Ocean City (Salisbury, but still) averaged .12″ in May, .32″ in June, and .15″ in July… so if anything, June would have been the month most tempered by precipitation.
Or it could just be that schools get out in early/mid-June (while this wouldn’t have a direct impact on criminal cases filed in District Court, since the overwhelming number of school-age children are under 18, it may have a snowball-type affect on crime generally).
Or it could be that the rate of change in the population itself caused a snowballing criminal impact… Or maybe a LOT of old cases got cleared in June… Or any number of other factors… still, it’s interesting to think about.
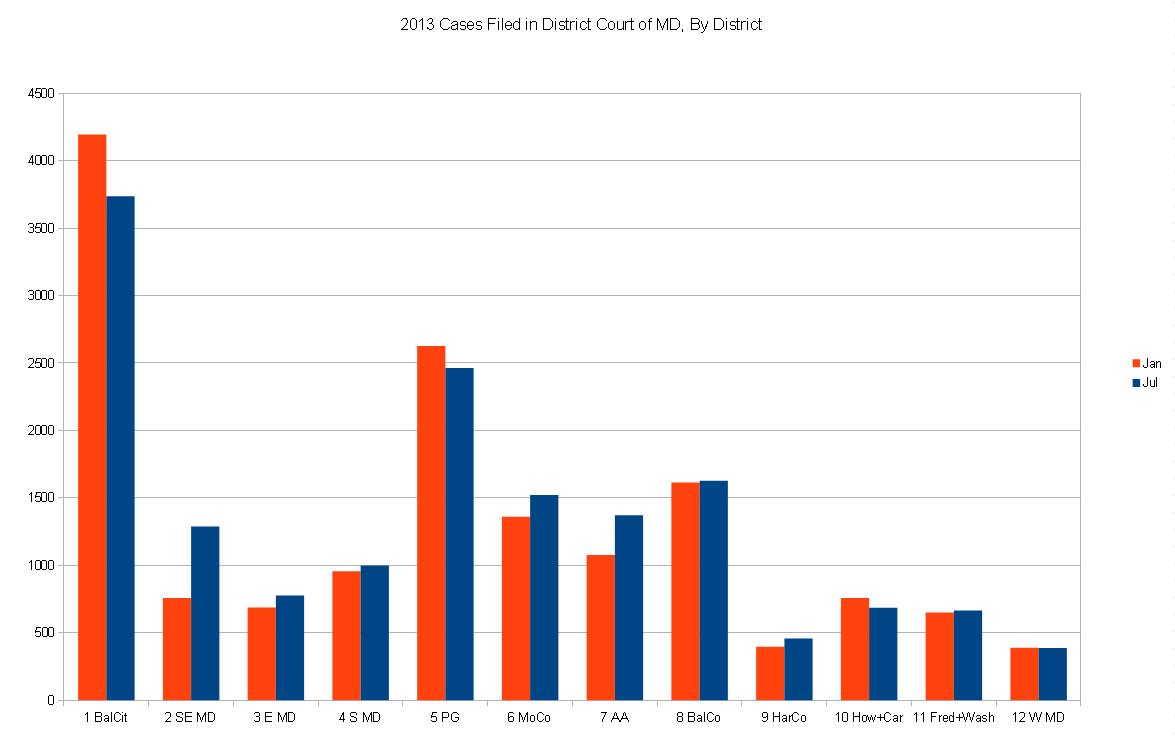
I finally broke down and separated out the data for all 12 judicial districts and so I contrasted each district’s July 2013 numbers with its January 2013 numbers to give a small degree of perspective (related primarily to the lack-of-change)
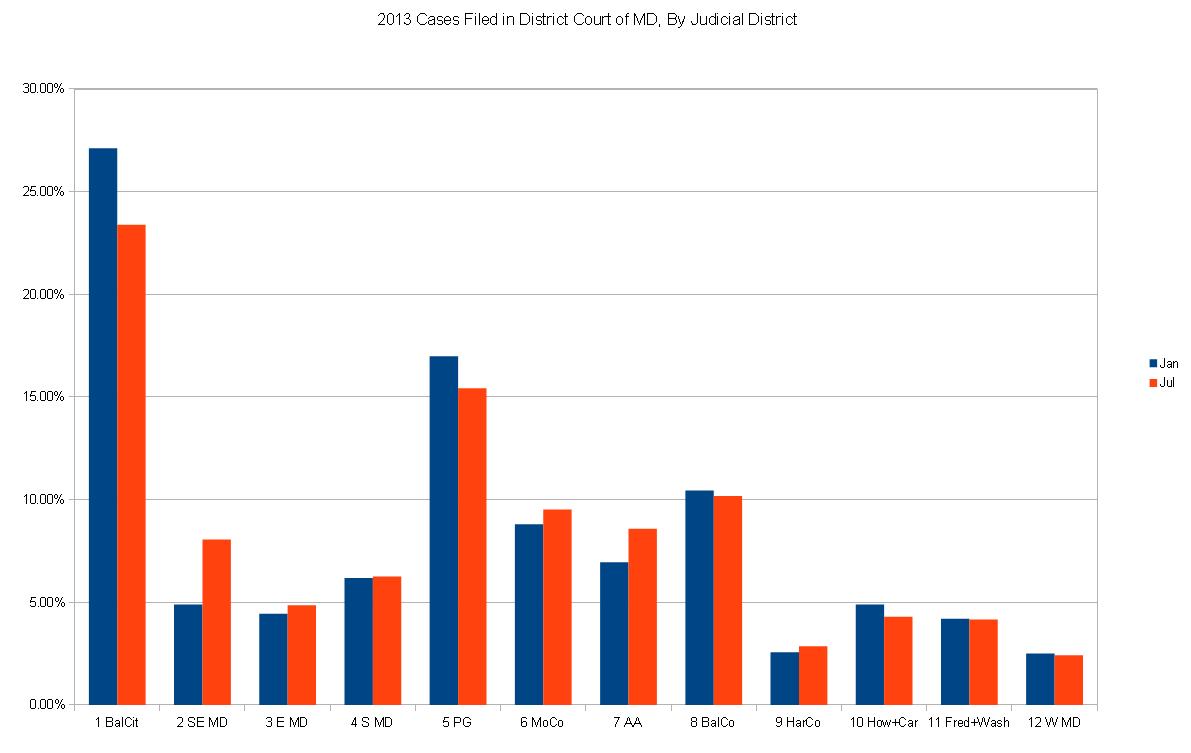
And here the districts are as a percentage of total DC cases filed in Maryland that month
* While previously I had only been updating the spreadsheet with the “top offenders” in terms of cases filed, I’m expanding the spreadsheets to include all 12 judicial districts and so it will be a little while before the spreadsheet on the side gets updated while I backfill the data for 2013.
June numbers are in and the stat spreadsheets to the right are updated.
I noticed that Baltimore City (District 1), PG County (District 5), and Baltimore County (District 8) were all holding pretty steady from May, but the rest of the state had a sharp uptick in criminal cases filed.
So if it wasn’t the usual offenders, who was it?
District 12 (Garrett, Allegany) dropped some and District 11 (Frederick, Washington), District 10 (Howard, Carroll), District 9 (Harford), District 7 (Anne Arundel), District 6 (Montgomery), District 4 (Calvert, Charles, St. Mary’s), and District 3 (Cecil, Kent, Queen Anne’s, Talbot, Caroline) were all almost exactly the same as in May.
District 2, meanwhile, went from 1063 to 1792- a nearly 68% increase! And while Dorchester, Somerset, Wicomico, and Snow Hill (it’s on the Eastern Shore off 113 between Berlin and Pocomoke City, if you were curious) didn’t have much change, Ocean City jumped from 330 cases filed in May to 1066 in June.
Note that in the chart above, Ocean City is included in “Rest of MD” and the spike in “Rest of MD” is almost entirely due to the spike in Ocean City. As a matter of fact, excluding Ocean City the number of criminal cases filed state-wide in the District Court of Maryland FELL 500 from May to June (a 3.26% decline).
Ocean City grows from a year-round population of around 7,089 to a population of 350,000 over the summer (The first number comes from the Census, but the second comes from The Sun, so… you know…).
Comparatively then, the increase in criminal cases filed- averaging around 85.5 from January to April and nearly as many (1066) as Anne Arundel County (1391) in June- is relatively mild. After all, that’s over 49 times more people with only 12.5 times as many criminal cases filed.
If The Sun was right…
April and May 2013 District Court of Maryland statistics are in and have been updated on the sidebar.
As you can see, 2011-2013 have all been relatively even… so I threw in 2005 as a reminder (2006 was actually even worse).
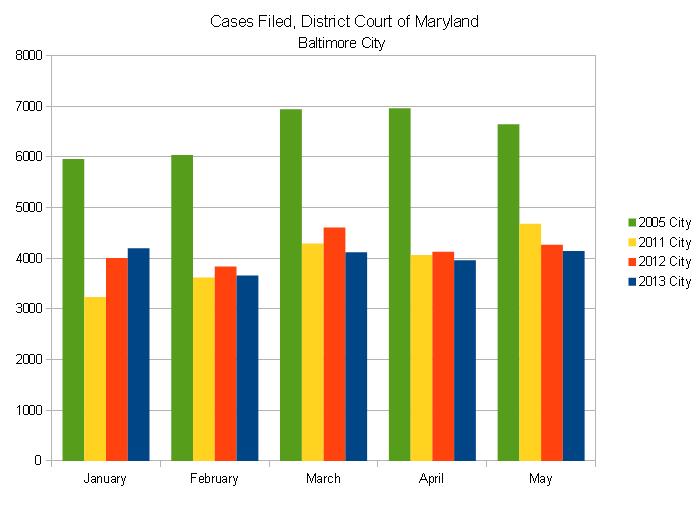
May 2013 marks the lowest number of May cases filed for Baltimore City in recent memory (at least since 2005). From 7,774 cases filed in May of 2006, there has been a decline (of varying degrees) every year.
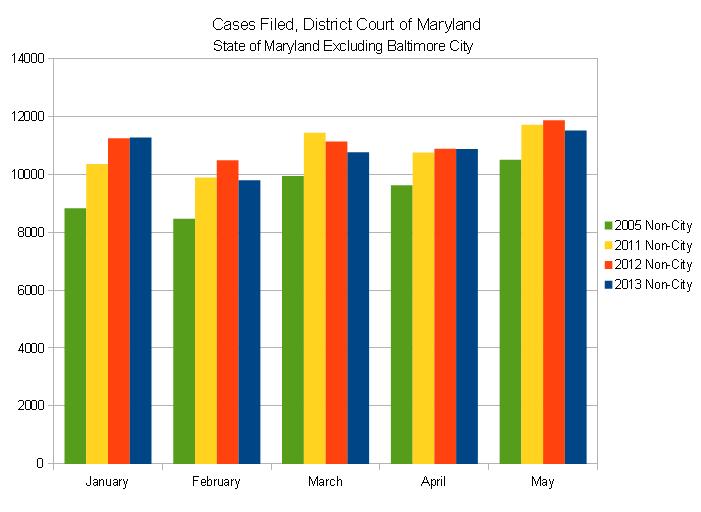
The rest of the state, however, has had a slightly different experience.
Below is a chart of criminal cases filed in the District Court of Maryland for Baltimore City. The chart is adjusted for the difference in days per month (standardized to 30), which evens out the original chart.
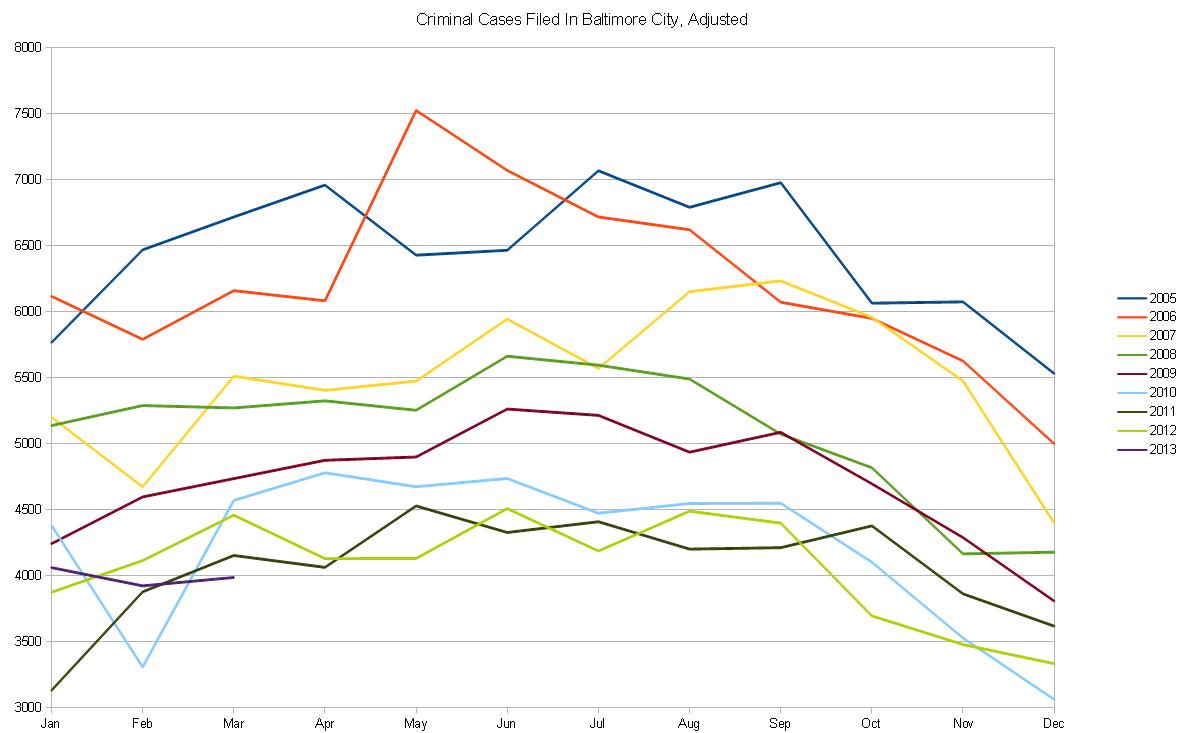
As you can see, March represents a surge forward from February and increases to June/July before declining until December. Following that trend, looking at the “change in cases filed” from the previous month gives us the following results:
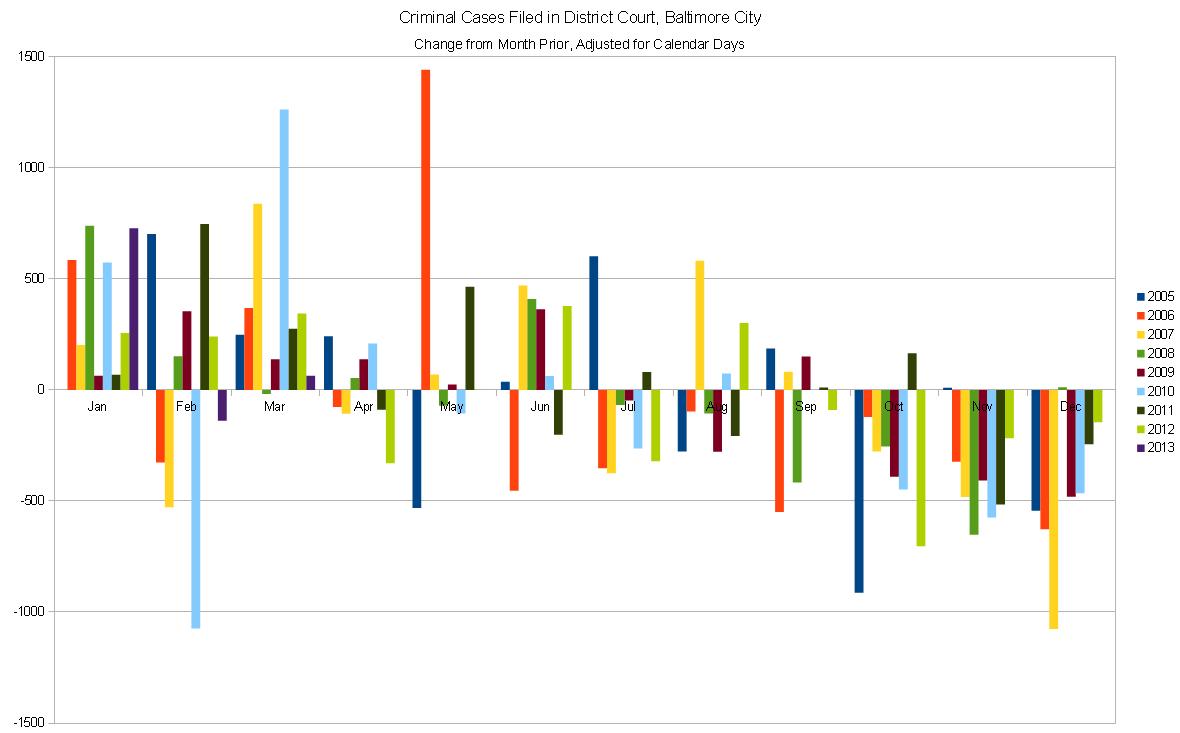
Which seems to show a decrease in cases starting around July and continuing until the “crime explosion” of January. In reality, January merely marks the end of the decline from the June/July peak and the beginning of the rise back toward the summer with a lull in February.
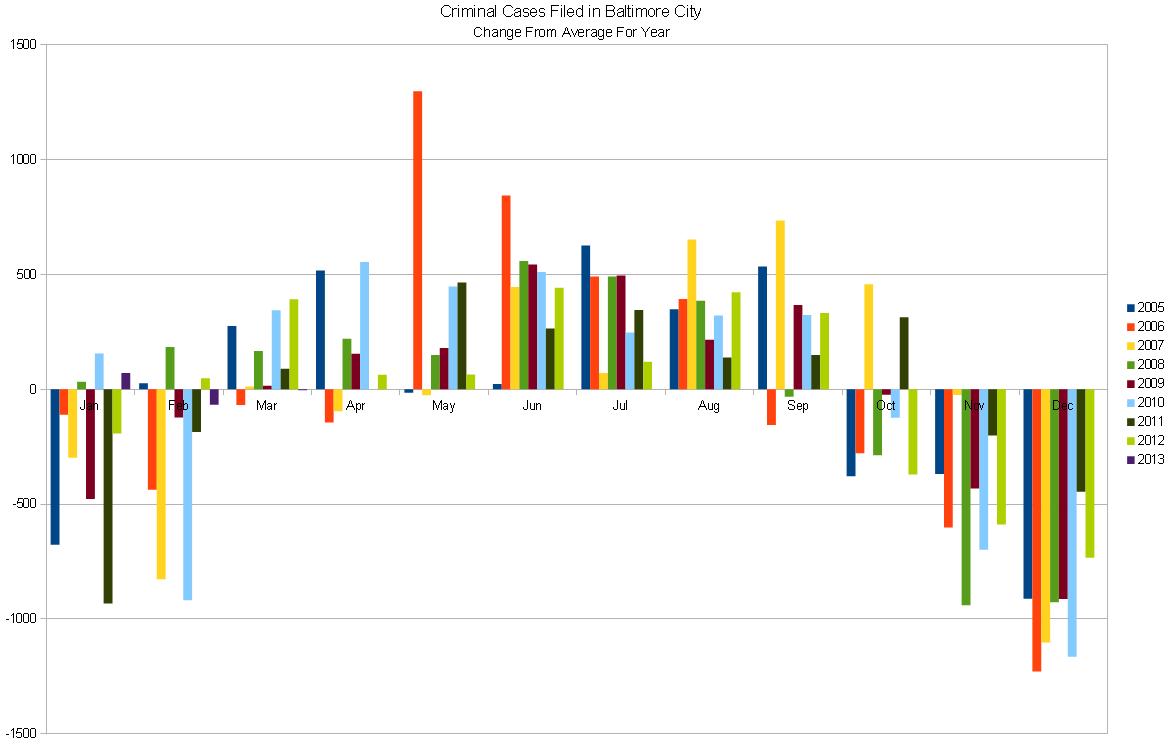
These graphs lead to a wide variety of questions:
Why the dramatic shift from December to January? Is this due to a surge in criminal New Years resolutions? Cabin fever?
Why, even standardized, does February still fall behind January in terms of criminal cases filed? Too much exertion for mid-winter in January?
What the heck happened in May/June 2006 to cause such a massive increase in cases filed?
What happened in February 2010 to cause such a drop?
Why are years 2005/2006, 2007/2008/2009, and 2010/2011/2012/2013 grouped the way they are?
Why is it that criminal cases filed fell on average from 2005-2009, but cases filed 2010-present have all been largely within the same range?
I’ll take a look at some possible explanations (and other questions) in later posts.
I’ve updated the spreadsheets for District Court of Maryland statistics from January 2005 to March 2013 and added a link to them on the sidebar ——->
After I wrote them about the errors in the last batch of numbers, the District Court number people updated the December 2012 and January 2013 numbers so that they’re (hopefully) correct now.
All data in these spreadsheets is taken from the statistics pdfs posted on the District Court of Maryland website located here and has been converted to a spreadsheet format for analysis.
Because my primary focus is crime trends in the larger jurisdictions (Baltimore City particularly), in addition to statistics for the State of Maryland as a whole I’ve taken the statistics for Baltimore City (primary focus), Baltimore County (large jurisdiction, adjacent to Baltimore City), and Prince George’s County (2nd largest, comparable issues) and added simple formulas to determine non-Baltimore-City data (cleverly labeled “non-city” in the spreadsheet) and non-big-3 data (labeled “remainder,” but so-labeled with love).
Open Office version
MS Excel version
The files are labeled “Core Stats” because they include only the published statistics and a simple formula for non-city and non-big-3 numbers. This makes it 1) easier to update and 2) easier for data-nerds out there to shape to fit their needs. Sorry if the month averaging screws you up for 2013, but it’s simple enough to remove if you want.
Also, I have a page 2 now!
I was waiting for the District Court of Maryland to update their December 2012 statistics so that I could do a “statistical year in review,” but they still haven’t… though they updated January with bad numbers, so hopefully that’ll get fixed soon. In the meantime, I’m going to try to keep up with recently published opinions in an effort to keep this site topical and regularly updated. The handbook is still in the works, but is going to take some serious time.
In the last post I linked to a compilation I did of statistics taken from the District Court Website from 2005-2012.
While that makes for a lot of numbers, perhaps the most critical to analysis of the criminal justice system is the number of cases filed. If we had 10 cases filed a year, for example, the system we’d design and the manner in which we’d treat the cases would be significantly different than if we had 100,000 cases filed a year. Unfortunately, with over 186,000 cases filed statewide in 2012, our system is forced to handle many cases rather than few.
And that’s where the statistics come in; using numbers properly, one can pick the system apart and see where inefficiencies have developed. Lest one believe that this is merely an intellectual exercise, “playing with numbers” of no consequence, where the lives and interests of the public are at stake along with the life and interests of a defendant, a structural “inefficiency” can have terrible consequences.
And so let’s take a look at “the big picture.”
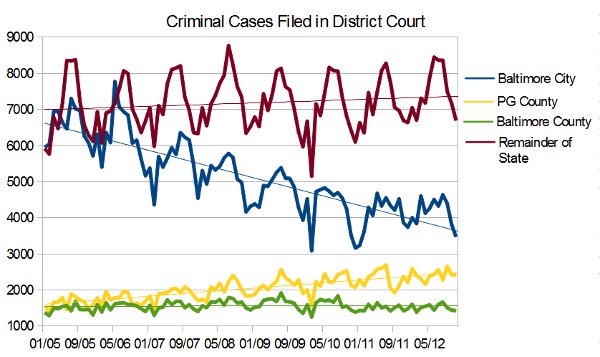
Taking the statistics at face value, it’s tempting to say that “crime” in Baltimore City is declining even as it rises throughout the rest of the state. After all, using annual numbers from 2005 to 2012 there was a 36.4% decline in cases filed in Baltimore City while the rest of the state experienced a 13.18% increase.
But measuring “crime” in such a manner ignores the fact that 2005 was “the height of the Baltimore Police Department’s experiment with zero-tolerance policing.” This meant that individuals committing “quality of life” crimes such as disorderly conduct, loitering, and the like were arrested with considerably greater frequency than the present. With the shift from zero-tolerance policing, the number of criminal cases filed has declined significantly. This does not necessarily mean that “crime” has declined, however, as a reduction in quality of life crimes may have masked an increase in other crimes.
What is certain, however, is that the nearly 40% decline in cases from 2005 should have had a profound impact on the criminal justice system in Baltimore City, particularly the District Court (the court having jurisdiction over these “quality of life” criminal cases).
In the next posting, I’ll take a look at trends that may contradict that assumption.