
Below is a chart of criminal cases filed in the District Court of Maryland for Baltimore City. The chart is adjusted for the difference in days per month (standardized to 30), which evens out the original chart.
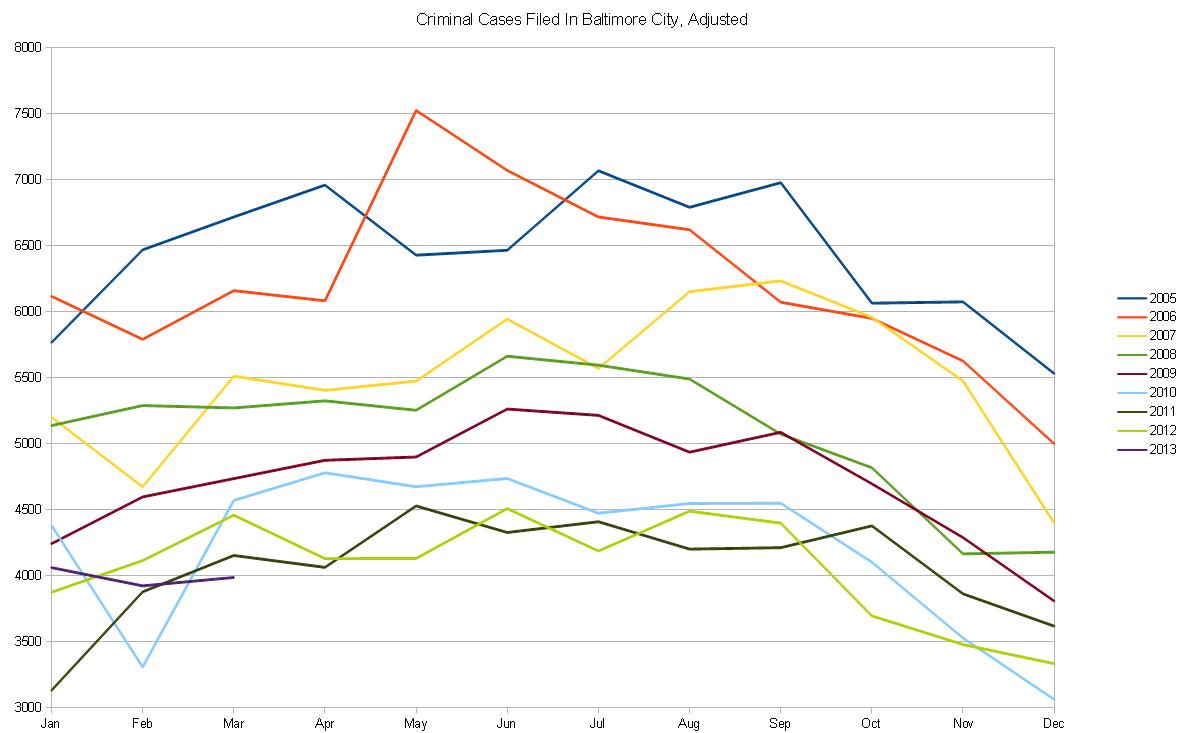
As you can see, March represents a surge forward from February and increases to June/July before declining until December. Following that trend, looking at the “change in cases filed” from the previous month gives us the following results:
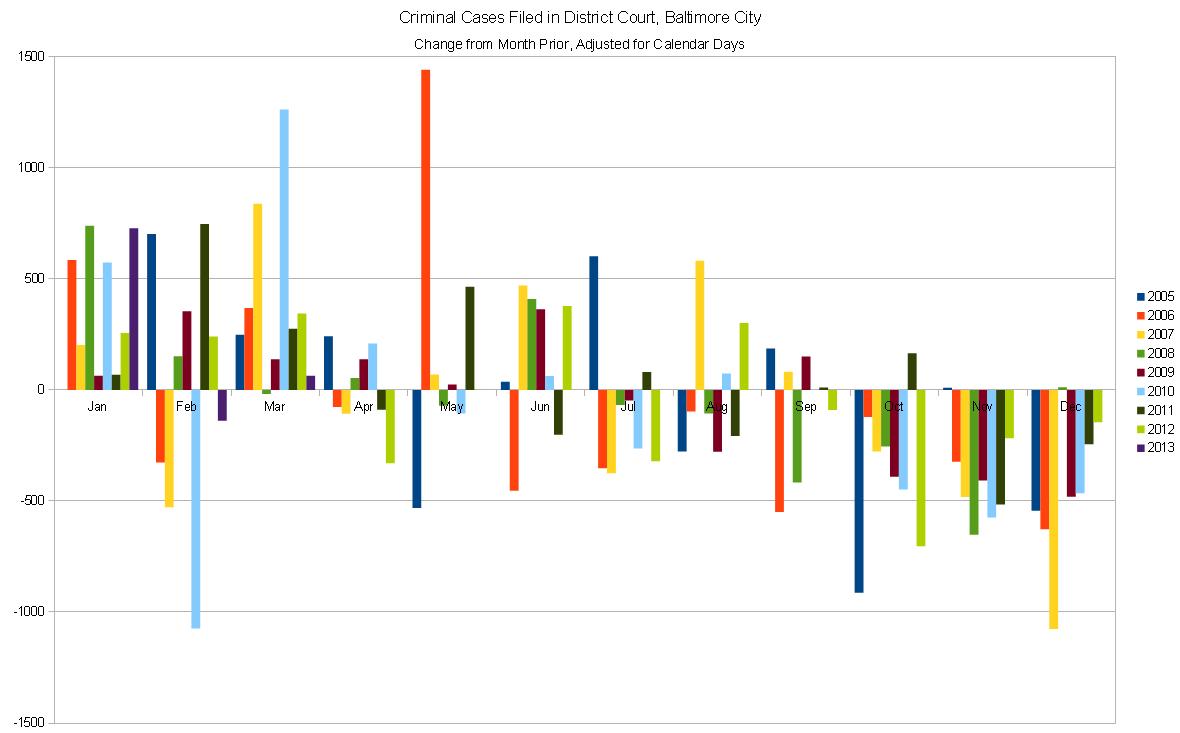
Which seems to show a decrease in cases starting around July and continuing until the “crime explosion” of January. In reality, January merely marks the end of the decline from the June/July peak and the beginning of the rise back toward the summer with a lull in February.
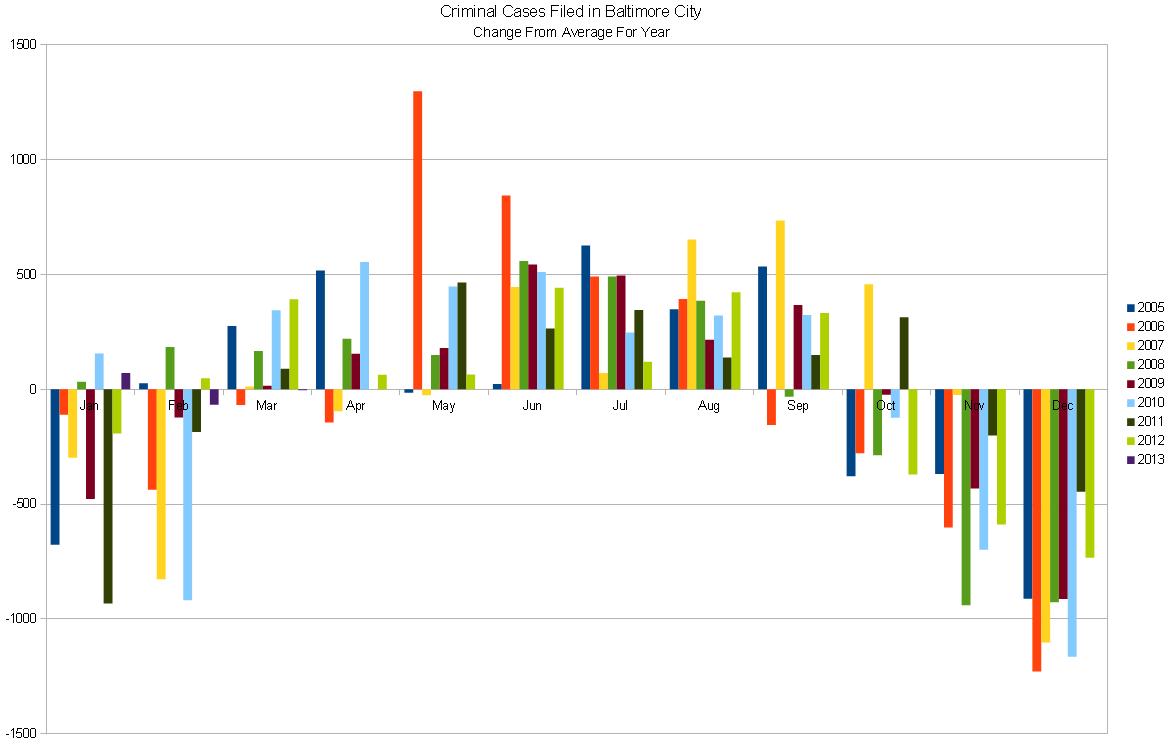
These graphs lead to a wide variety of questions:
Why the dramatic shift from December to January? Is this due to a surge in criminal New Years resolutions? Cabin fever?
Why, even standardized, does February still fall behind January in terms of criminal cases filed? Too much exertion for mid-winter in January?
What the heck happened in May/June 2006 to cause such a massive increase in cases filed?
What happened in February 2010 to cause such a drop?
Why are years 2005/2006, 2007/2008/2009, and 2010/2011/2012/2013 grouped the way they are?
Why is it that criminal cases filed fell on average from 2005-2009, but cases filed 2010-present have all been largely within the same range?
I’ll take a look at some possible explanations (and other questions) in later posts.